Say you want to be notified everytime a specific event occurs in your GCP project or organization such as an admin being added, a bucket being created, a firewall rule being modified, etc… How should you do it?
After some trial and error, i have found that the method below gives the best results. Some other types of alerting create multiple alerts for a single event, or re-create and incident after you close it.
Step 1: Create a filter a metric
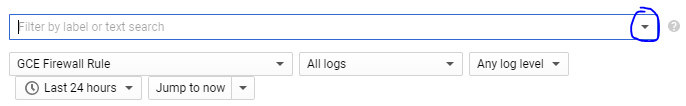
Go to https://console.cloud.google.com/logs/viewer and use keyword to search for the event you want to monitor. Be sure to select the proper source of logs too. If you’re searching for firewall logs, set it as “GCE Firewall rule” for example. If no event appears, try expanding the time range.
For each event that appears, you can expand it and click on each field that you want to filter. This will automatically create an advanced filter for you, which is basically a fancy search query. Remember that you can also mix different fields using terms like AND, OR and ( ) for applying precedence.
If you already have your search query ready, just click on the little arrow and select “Convert to Advanced Filter”
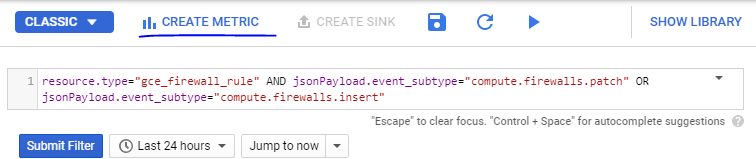
This is the query for firewall rules modifications that is in the CIS benchmark for GCP:
resource.type=”gce_firewall_rule” AND jsonPayload.event_subtype=”compute.firewalls.patch” OR jsonPayload.event_subtype=”compute.firewalls.insert”
Make sure to tune your query until you are only seeing the events you want.
Step 2: Create a metric
Once you have your filter working OK, just click CREATE METRIC on the top of the page.
A little window will pop-up. Just fill it with a name and description. if you want to you can specify a unit, which is basically a unit of measurement such as cm, ml, kg, whatever.
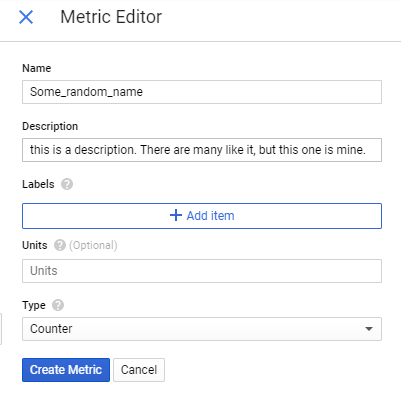
Just hit “Create Metric” when you’re done.
Step 3: Create an alert
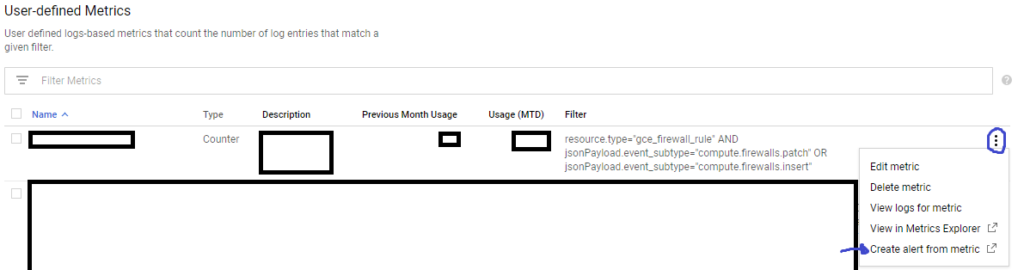
After creating your metric, go to https://console.cloud.google.com/logs/metrics and scroll down to User-defined Metrics. You should find your metric there. Clik on the three vertical dots and select “Create Alert From Metric”
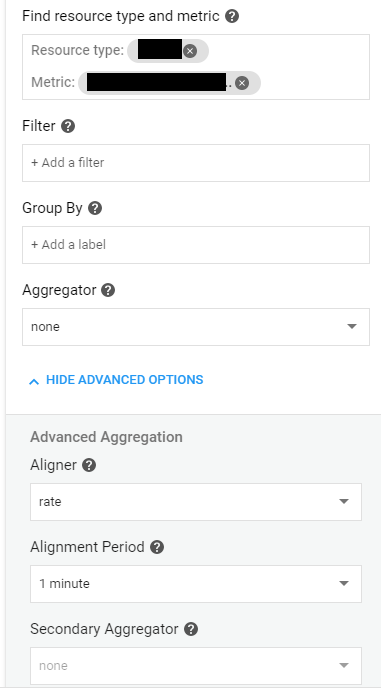
A new window will pop up with a graph showing past occurrences of whatever your metric is monitoring.
IMPORTANT: You may not see any data on the graph, but that’s completely normal. Metrics do not “backfill”, i.e., they aren’t populated with events before their creation.
ALSO IMPORTANT: For firewall rules, you will get an error saying “This aggregation does not produce a valid data type for a Line plot type.”. Just change the resource type from gce_firewall_rule to global .
Configure your alert like this:
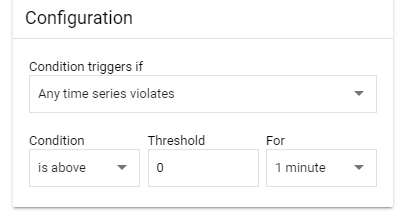
Hit “Save“.
After that you just need to give your alert a name, specify a notification channel (how you would like to be notified) and if you want to a documentation, which is the text that will come with the alert. When you’re done, hit save.
That’s it! You should still test your alert tho, just to be sure.
Caveats
This type of alert will send a notification whenever the specific event/log is detected and create an incident for it. If the event/log does not appear again in the next minute, it will auto-resolve the incident. It will also not create multiple incidents for multiple logs if they happen within 1m of each other.
There is currently no way of turning auto-resolve off or specifying that 1 log = 1 incident.
Views: 132